
IMEMR
EMRO
Volume 6, Issue 3 (2025)
J Clinic Care Skill 2025, 6(3): 121-128 |
Back to browse issues page
Article Type:
Subject:


Ethics code: IR.YUMS.REC.1402.152
History
Received: 2025/05/28 | Accepted: 2025/07/2 | Published: 2025/07/8
Received: 2025/05/28 | Accepted: 2025/07/2 | Published: 2025/07/8
How to cite this article
Ghaderzadeh M, Salehnasab C. Filter-Based Feature Selection for Type II Diabetes Prediction. J Clinic Care Skill 2025; 6 (3) :121-128
URL: http://jccs.yums.ac.ir/article-1-427-en.html
URL: http://jccs.yums.ac.ir/article-1-427-en.html
Download citation:
BibTeX | RIS | EndNote | Medlars | ProCite | Reference Manager | RefWorks
Send citation to:


Rights and permissions
BibTeX | RIS | EndNote | Medlars | ProCite | Reference Manager | RefWorks
Send citation to:


1- Department of Medical Informatics, Boukan School of Medical Sciences, Urmia University of Medical Sciences, Urmia, Iran
2- Social Determinants of Health Research Center, Yasuj University of Medical Sciences, Yasuj, Iran
2- Social Determinants of Health Research Center, Yasuj University of Medical Sciences, Yasuj, Iran
Full-Text (HTML) (168 Views)
Introduction
Type 2 diabetes mellitus (T2DM) is a chronic, progressive metabolic disorder that has emerged as one of the leading public health challenges of the 21st century. Current estimates suggest that nearly 600 million people live with the condition worldwide, and this number is projected to rise by another 250 million within the next two decades [1, 2]. The disease not only causes lifelong morbidity and premature mortality but also exerts a profound financial strain, with global costs surpassing one trillion US dollars annually [3, 4]. The burden is particularly acute in low- and middle-income countries, where limited healthcare resources must be stretched across competing priorities [5].
Efforts to reduce this burden hinge on prevention and early detection, as intervening before the onset of complications is far more effective than treating advanced disease. Traditional risk assessment tools, which are based on family history, anthropometry, or laboratory markers, offer partial guidance but often lack precision when applied to diverse populations. Advances in data science, particularly in predictive modeling, have introduced the possibility of integrating multiple clinical and lifestyle parameters to forecast diabetes risk with greater accuracy [6, 7].
Among predictive approaches, logistic regression remains highly relevant in medicine despite the rise of complex machine learning algorithms. Its strength lies not only in statistical robustness but also in its interpretability—clinicians can understand and communicate the role of individual predictors to patients, making it suitable for clinical decision-making [8]. However, two major obstacles persist. First, there is class imbalance: In most cohorts, the number of individuals with diabetes is small compared to those without, which biases models toward the majority class. Techniques, such as the synthetic minority oversampling technique (SMOTE), can mitigate this problem, but they require careful implementation [9-11]. Second, and perhaps more fundamentally, is the challenge of feature selection: Clinical datasets often contain dozens of correlated or redundant parameters, and retaining irrelevant predictors can reduce both accuracy and interpretability [12].
Feature selection is not simply a statistical convenience; it is a clinical necessity. Selecting the most informative predictors ensures that models reflect meaningful patient risk factors, facilitate translation into practice, and prevent “black box” outputs that lack clinical trust. Among the available strategies, filter-based methods are attractive because they are computationally efficient, model-agnostic, and capable of ranking predictors according to their statistical relationship with the outcome before model development [13, 14].
Three filter methods are especially prominent. ANOVA (f-classif) is well-suited for continuous predictors, identifying parameters that differentiate between diabetic and non-diabetic groups. Mutual information (MI) is more flexible, capturing both linear and non-linear dependencies, including complex interactions between lifestyle and biological factors. In contrast, Chi-square tests are designed for categorical or frequency-based parameters, highlighting associations such as the presence of comorbidities or lifestyle behaviors. Each of these methods has proven valuable in biomedical research; however, their relative strengths and limitations in the specific context of T2DM prediction remain underexplored.
Recent work underscores the importance of feature selection for both accuracy and interpretability. A 2024 study using the UK Biobank (~450,000 participants) demonstrates that a compact 10-parameter model (including HbA1c, BMI, waist circumference, fasting glucose, liver enzymes, high-density lipoprotein cholesterol (HDL-C), age, and urate) achieves high predictive accuracy (AUC≈0.88) with boosted tree models [15]. A study highlights the limitations of conventional logistic regression in the presence of multicollinearity, showing that machine learning models with robust feature selection strategies offer greater stability and interpretability in population-based risk assessment [16]. More recently, hybrid metaheuristic frameworks have been applied to optimize both prediction accuracy and computational efficiency while retaining clinically meaningful feature subsets, further illustrating the growing demand for rigorous parameter selection in diabetes prediction [17].
To address this gap, the present study applied ANOVA, MI, and Chi-square test feature selection to data from the Dena-PERSIAN cohort, a large population-based study in Iran. After preparing and balancing the dataset, we compared the top-ranked predictors identified by each method and tested their impact on logistic regression performance. By situating these methods side by side, our goal was not only to determine which yields the most reliable predictors but also to examine whether different approaches emphasize distinct clinical dimensions of risk. Ultimately, this work aimed to inform both data scientists and clinicians about the trade-offs between statistical rigor and clinical interpretability in the quest for earlier and more accurate identification of individuals at risk for T2DM.
Instrument and Methods
This investigation was carried out on a subset of the Dena-PERSIAN cohort, which enrolled adults aged 35 to 70 years. Information from 3,203 individuals was used, of whom 402 (12.55%) had a confirmed diagnosis of T2DM. The dataset included parameters from demographic (e.g., age), laboratory (e.g., fasting blood sugar (FBS), lipid profile), lifestyle (e.g., driving hours, television watching), and medical history (e.g., fatty liver, kidney stones) domains.
Before analysis, the data underwent several preparation steps. Missing entries were estimated using multivariate iterative imputation [6]. Continuous parameters were rescaled to fall within a 0-1 range, and categorical parameters were converted into binary indicators. Unusual values were addressed using interquartile range checks, while skewed parameters were smoothed using a Yeo-Johnson adjustment [7].
The analysis used retrospective, anonymized data from the PERSIAN cohort (adults aged 35-70 years). This study adhered to the Declaration of Helsinki. All participants in the original cohort provided written informed consent for the future research use of their data. No direct participant contact occurred, and all records were de-identified before analysis.
Because individuals with diabetes made up only about one in eight participants, we balanced the dataset using the SMOTE [8-10]. This approach generates synthetic diabetes cases until both classes appear in roughly equal numbers, reducing the bias of the model toward the majority group.
We compared three classical filter methods: ANOVA (f-classif), which identifies continuous predictors that effectively separate diabetic and non-diabetic groups; MI, which estimates the extent to which knowledge of one parameter reduces uncertainty about diabetes status [11-13]; and Chi-square (χ²), which assesses the dependence between categorical or non-negative predictors and the outcome [14].
Each method produced a ranked list of predictors. For fairness, we retained only the top five from each list and used these in model training.
Separate logistic regression models were created for each feature set (one for ANOVA, one for MI, and one for the Chi-square test). Training utilized 80% of the data, while 20% was reserved as the test set. Models were fitted with a maximum of 1,000 iterations and a fixed random seed to ensure reproducibility. Performance was assessed on the test set using accuracy, precision, recall, and F1-score [3, 4].
All steps were coordinated in the PyCaret environment, which streamlined preprocessing, feature selection, and model training into a single reproducible pipeline. Within PyCaret, we applied the same transformations described earlier (imputation, scaling, variance reduction, and multicollinearity pruning) before model fitting. This framework ensured consistency across all three feature selection strategies.
Analyses were run in Python 3.10. The libraries included scikit-learn for modeling, imbalanced-learn for SMOTE, PyCaret for workflow automation, and Plotly for figures. The entire project was managed under version control and containerized with Docker, ensuring that the analysis can be replicated on other systems without changes.
Findings
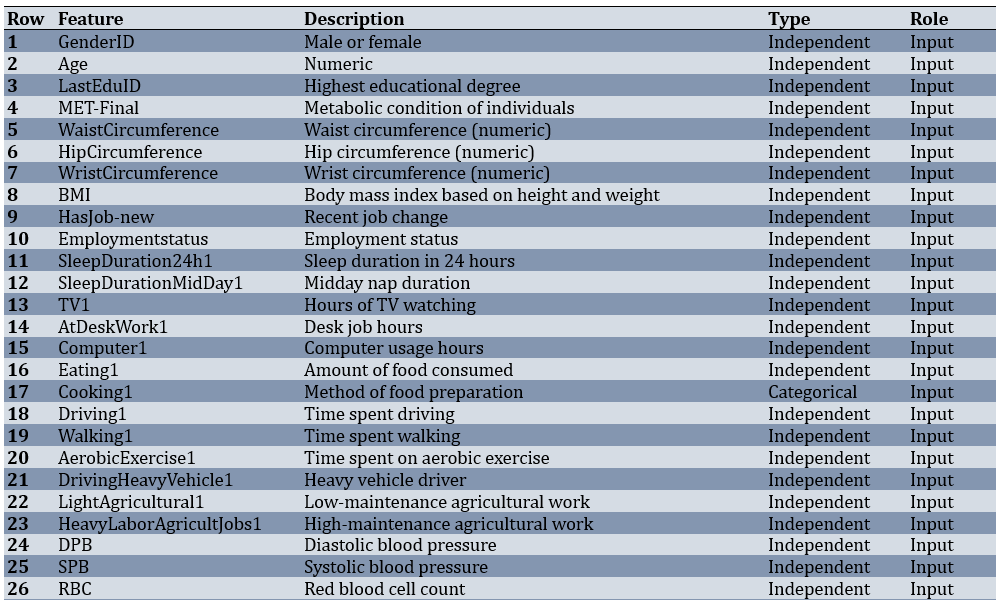
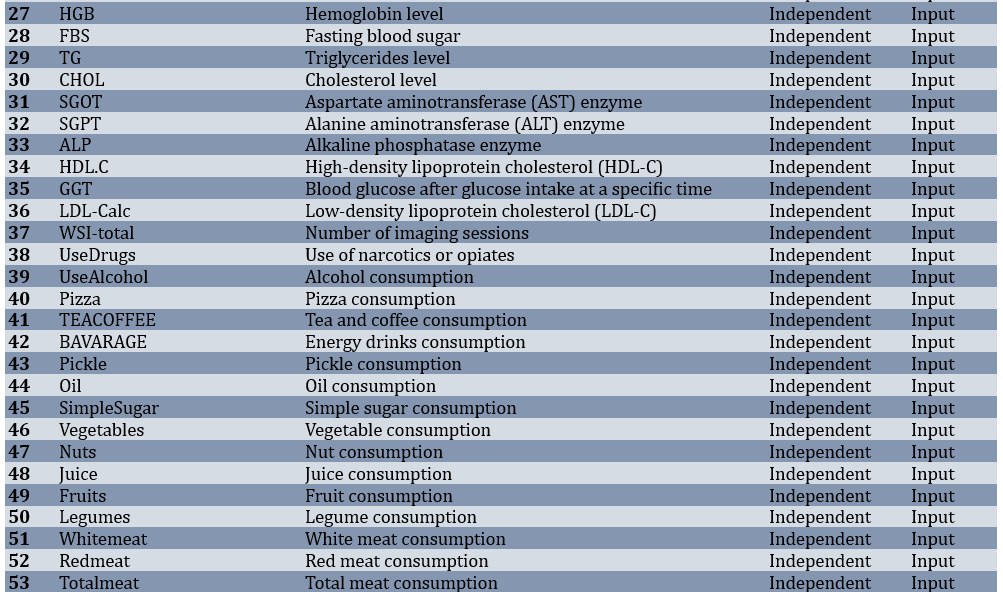
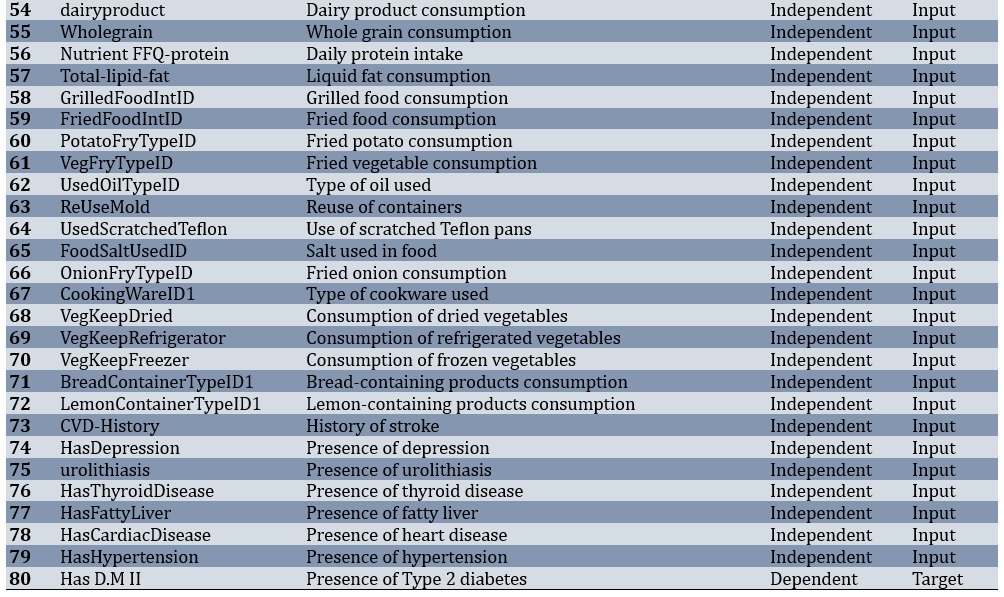
Of 3,203 adults, 402 participants (12.55%) had T2DM, while 2,801 (87.45%) were non-diabetic. Before modeling, the dataset underwent several preparation steps. Records with more than half of their values missing were removed, features with very low variability were excluded, and the remaining gaps were filled using a most-frequent strategy. After these steps, the working dataset consisted of 3,203 samples and 80 predictors covering demographic, lifestyle, laboratory, and medical history parameters (Table 1).
Table 1. Features and specifications of the dataset
ANOVA ranked FBS at the top, followed by age and fatty liver status, with triglycerides (TG) and kidney stone history completing the five most influential features (Figure 1). The sharp drop in scores after the first three indicated that most of the predictive value lay within this compact clinical core.

Figure 1. Most important features ranked by ANOVA (f-classif).
MI also prioritized FBS and age, but it assigned weight to HDL-C and two daily driving time and television viewing lifestyle behaviors (Figure 2). These non-linear associations were plausible contributors to risk, but they did not enhance performance in a linear classifier.

Figure 2. Most important features ranked by mutual information.
Chi-square test emphasized categorical parameters, ranking fatty liver and kidney stones above age, energy drink use (BAVARAGE), and FBS (Figure 3). While clinically relevant, these features provided weaker linear separability compared to continuous laboratory measures.

Figure 3. Most important features ranked by the Chi-square test.
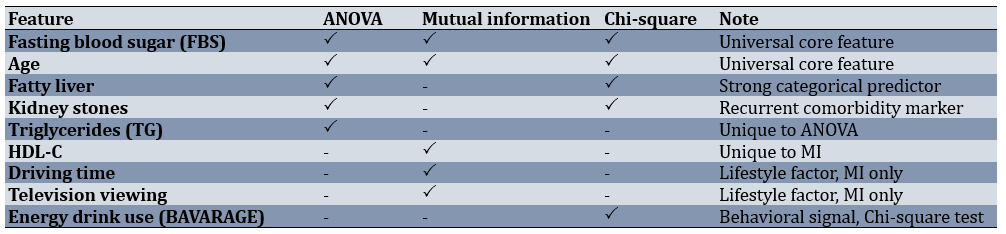
Because each method emphasized a slightly different mix of features, a side-by-side comparison helps identify the predictors that were stable across methods versus those that were method-specific. FBS and age were universal; fatty liver and kidney stones appeared in two methods, while TG (ANOVA), HDL-C, lifestyle factors (MI), and energy drink use (Chi-square test) were unique (Table 2).
Table 2. Shared and unique top features across the three filter methods
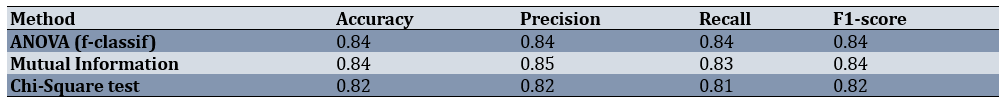
When logistic regression models were trained on the top five features from each method, both ANOVA and MI achieved strong and nearly identical results (Figure 4, Table 3). The ANOVA-based model produced an accuracy of 0.84 and an F1-score of 0.84, while the MI-based model also reached an accuracy of 0.84 and an F1-score of 0.84, with slightly higher precision (0.85). The Chi-square-based model performed slightly lower, with an accuracy of 0.82 and an F1-score of 0.82.
This indicates that both ANOVA and MI identified feature sets that worked well with a linear model, albeit with different emphases (ANOVA on metabolic markers and MI on lifestyle and lipid features). Chi-square test, while still reasonably strong, lagged behind slightly due to its focus on categorical indicators.
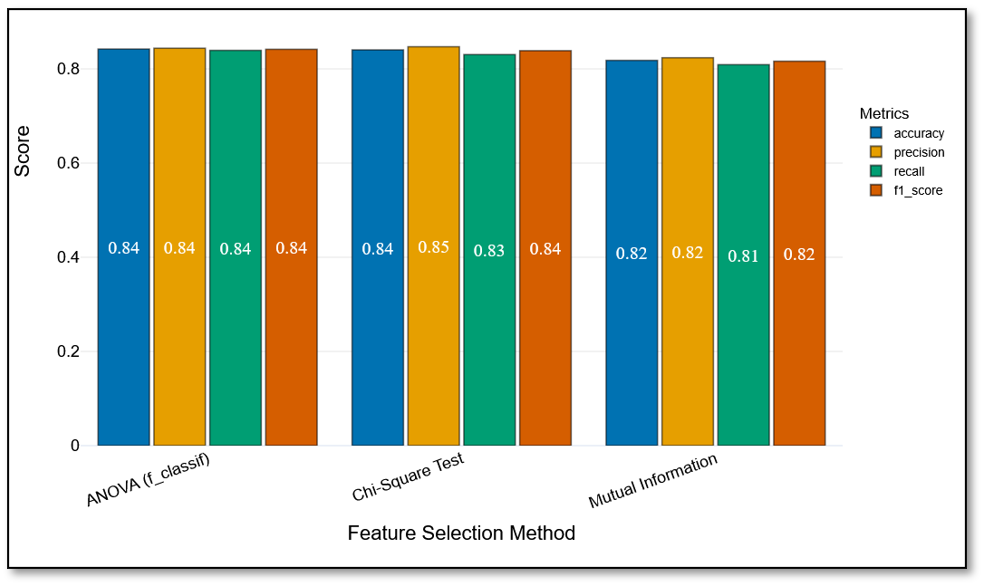
Figure 4. Test-set performance of logistic regression models trained on features selected by ANOVA, mutual information, and Chi-square test.
Table 3. Performance metrics of logistic regression models on the test set
The consolidated ranking of the top 15 features (Figure 5) confirmed the dominance of FBS, age, and fatty liver status, which consistently appeared at the top across all methods. Additional contributors included kidney stones and TG (ANOVA and Chi-square test), HDL-C (MI), and lifestyle parameters, such as driving time, television viewing, and energy drink use. The steep decline in importance beyond the first five predictors suggests that most of the discriminative capacity resides in a small clinical core, with secondary features adding marginal or context-specific value.
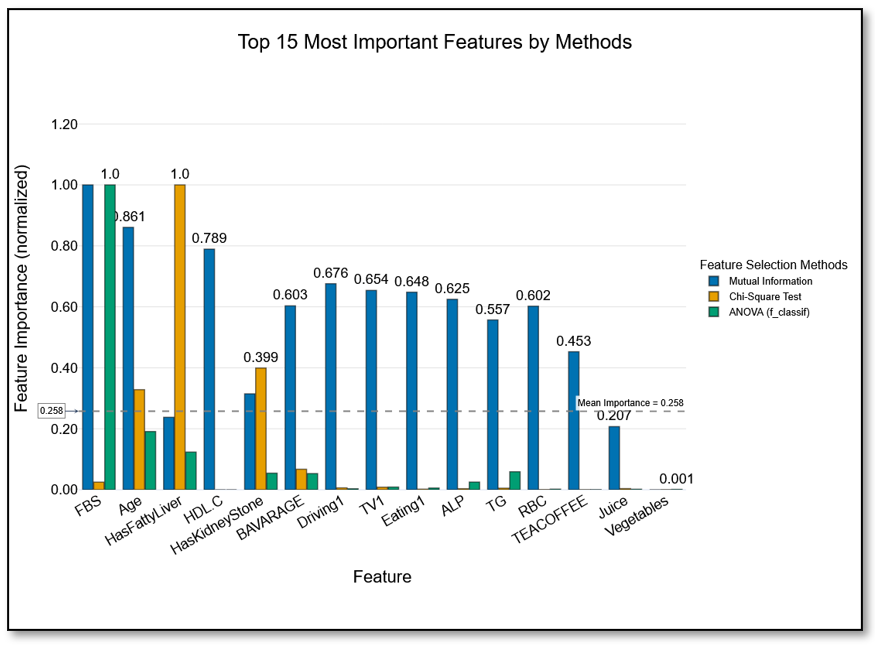
Figure 5. The top 15 most important features across ANOVA, mutual information, and Chi-square test.
The consensus analysis confirmed that most of the predictive strength was concentrated in a compactt triad of FBS, age, and fatty liver, with other parameters adding method-specific but modest value.
Discussion
This study compared three classical filter-based feature selection methods (ANOVA, MI, and Chi-square test) for predicting T2DM using data from the Dena Cohort. Across all methods, FBS and age consistently emerged as dominant predictors, reinforcing their central role in diabetes risk assessment [12-14]. Fatty liver was also highlighted by ANOVA and Chi-square test, aligning with prior evidence linking non-alcoholic fatty liver disease to insulin resistance and subsequent diabetes onset [15, 16].
When evaluated in logistic regression models, ANOVA and MI achieved nearly identical performance (accuracy and F1-score=0.84), while the Chi-square test lagged slightly (accuracy=0.82; F1-score=0.82). This finding suggests that both ANOVA and MI can generate clinically useful predictor subsets for linear models, though their emphases differ: ANOVA favored metabolic and biochemical parameters, whereas MI captured lipid abnormalities and lifestyle behaviors, such as driving and television viewing. These patterns echo recent large-scale evidence, including results from the UK Biobank (≈450,000 participants), where metabolic factors, such as HbA1c, BMI, waist circumference, and liver enzymes dominated prediction, but lifestyle indicators and HDL cholesterol also contributed significantly [17].
The results also align with a broader trend in diabetes prediction research. Li et al. emphasized that while logistic regression remains widely used in clinical studies, its performance is vulnerable to multicollinearity and redundant parameters, underscoring the importance of effective feature selection [18]. A recent systematic review and meta-analysis of machine learning models confirms that appropriate feature selection substantially improves both accuracy and interpretability in diabetes prediction [19]. Ensemble frameworks that combine multiple feature selection strategies with classifiers have also been shown to enhance robustness and reduce model variance, particularly in heterogeneous datasets [20].
Interpretability remains another critical theme. SHAP-based methods have gained traction as a way to bridge machine learning predictions with clinical understanding by quantifying the contribution of each feature to individual risk scores [21]. Such approaches highlight the importance of not only achieving accuracy but also ensuring transparency in decision-support systems. Likewise, hybrid deep learning approaches that integrate feature selection with advanced architectures are increasingly being tested for early diabetes detection, though their complexity raises new challenges for implementation in routine care [22].
A major strength of our work lies in the standardized preprocessing pipeline, which includes imputation, normalization, and oversampling with SMOTE. This approach reduced bias caused by class imbalance and ensured comparability across methods [9-11]. The convergence of results, particularly the consistent identification of FBS, age, and fatty liver, underscores the robustness of these predictors across different statistical approaches and reflects their established clinical importance.
Nevertheless, some limitations must be acknowledged. First, the analysis was restricted to a single cohort, which may limit generalizability. Second, we only tested one classifier, logistic regression, which may not fully leverage the non-linear features emphasized by MI. Prior studies show that these features may contribute more substantially in ensemble or tree-based models [17, 18, 20, 23]. Finally, although the preprocessing was carefully designed, some categorical variables may have lost nuance through one-hot encoding, potentially reducing their discriminative capacity.
Future work should therefore expand validation to multi-cohort datasets, test non-linear classifiers, and examine hybrid or metaheuristic pipelines that integrate filter methods with advanced optimization strategies [22, 24-26]. By combining interpretability with predictive strength, such models can support clinicians in identifying high-risk individuals earlier, ultimately guiding more effective preventive strategies and resource allocation.
We compared three classical filter-based feature selection methods for T2DM prediction using data from the Dena-PERSIAN cohort. Across all approaches, FBS, age, and fatty liver consistently emerged as the most robust predictors, while ANOVA and MI provided the strongest and most clinically meaningful feature subsets. These findings highlight the value of ANOVA and MI for building interpretable prediction models and suggest that their complementary strengths may be best leveraged in hybrid or ensemble frameworks for early diabetes risk assessment.
Conclusion
ANOVA and MI produce clinically meaningful and stable feature subsets for T2DM prediction, centered on fasting glucose, age, and fatty liver.
Acknowledgments: The authors thank the Dena-PERSIAN Cohort study team for their invaluable efforts in data collection and management. The Social Determinants of Health Research Center at Yasuj University of Medical Sciences is also acknowledged for its academic support and technical advice during the study.
Ethical Permissions: Ethical approval was granted by the Institutional Review Board of Yasuj University of Medical Sciences, Yasuj, Iran (IR.YUMS.REC.1402.152).
Conflicts of Interests: The authors declared no conflicts of interests related to this work.
Authors' Contribution: Ghaderzadeh M (First Author), Introduction Writer/Methodologist/Assistant Researcher/Discussion Writer/Statistical Analyst (40%); Salehnasab C (Second Author), Introduction Writer/Methodologist/Main Researcher/Discussion Writer/Statistical Analyst (60%)
Funding/Support: This study did not receive any external funding. All analyses and manuscript preparation were conducted with institutional support from the Yasuj University of Medical Sciences.
Type 2 diabetes mellitus (T2DM) is a chronic, progressive metabolic disorder that has emerged as one of the leading public health challenges of the 21st century. Current estimates suggest that nearly 600 million people live with the condition worldwide, and this number is projected to rise by another 250 million within the next two decades [1, 2]. The disease not only causes lifelong morbidity and premature mortality but also exerts a profound financial strain, with global costs surpassing one trillion US dollars annually [3, 4]. The burden is particularly acute in low- and middle-income countries, where limited healthcare resources must be stretched across competing priorities [5].
Efforts to reduce this burden hinge on prevention and early detection, as intervening before the onset of complications is far more effective than treating advanced disease. Traditional risk assessment tools, which are based on family history, anthropometry, or laboratory markers, offer partial guidance but often lack precision when applied to diverse populations. Advances in data science, particularly in predictive modeling, have introduced the possibility of integrating multiple clinical and lifestyle parameters to forecast diabetes risk with greater accuracy [6, 7].
Among predictive approaches, logistic regression remains highly relevant in medicine despite the rise of complex machine learning algorithms. Its strength lies not only in statistical robustness but also in its interpretability—clinicians can understand and communicate the role of individual predictors to patients, making it suitable for clinical decision-making [8]. However, two major obstacles persist. First, there is class imbalance: In most cohorts, the number of individuals with diabetes is small compared to those without, which biases models toward the majority class. Techniques, such as the synthetic minority oversampling technique (SMOTE), can mitigate this problem, but they require careful implementation [9-11]. Second, and perhaps more fundamentally, is the challenge of feature selection: Clinical datasets often contain dozens of correlated or redundant parameters, and retaining irrelevant predictors can reduce both accuracy and interpretability [12].
Feature selection is not simply a statistical convenience; it is a clinical necessity. Selecting the most informative predictors ensures that models reflect meaningful patient risk factors, facilitate translation into practice, and prevent “black box” outputs that lack clinical trust. Among the available strategies, filter-based methods are attractive because they are computationally efficient, model-agnostic, and capable of ranking predictors according to their statistical relationship with the outcome before model development [13, 14].
Three filter methods are especially prominent. ANOVA (f-classif) is well-suited for continuous predictors, identifying parameters that differentiate between diabetic and non-diabetic groups. Mutual information (MI) is more flexible, capturing both linear and non-linear dependencies, including complex interactions between lifestyle and biological factors. In contrast, Chi-square tests are designed for categorical or frequency-based parameters, highlighting associations such as the presence of comorbidities or lifestyle behaviors. Each of these methods has proven valuable in biomedical research; however, their relative strengths and limitations in the specific context of T2DM prediction remain underexplored.
Recent work underscores the importance of feature selection for both accuracy and interpretability. A 2024 study using the UK Biobank (~450,000 participants) demonstrates that a compact 10-parameter model (including HbA1c, BMI, waist circumference, fasting glucose, liver enzymes, high-density lipoprotein cholesterol (HDL-C), age, and urate) achieves high predictive accuracy (AUC≈0.88) with boosted tree models [15]. A study highlights the limitations of conventional logistic regression in the presence of multicollinearity, showing that machine learning models with robust feature selection strategies offer greater stability and interpretability in population-based risk assessment [16]. More recently, hybrid metaheuristic frameworks have been applied to optimize both prediction accuracy and computational efficiency while retaining clinically meaningful feature subsets, further illustrating the growing demand for rigorous parameter selection in diabetes prediction [17].
To address this gap, the present study applied ANOVA, MI, and Chi-square test feature selection to data from the Dena-PERSIAN cohort, a large population-based study in Iran. After preparing and balancing the dataset, we compared the top-ranked predictors identified by each method and tested their impact on logistic regression performance. By situating these methods side by side, our goal was not only to determine which yields the most reliable predictors but also to examine whether different approaches emphasize distinct clinical dimensions of risk. Ultimately, this work aimed to inform both data scientists and clinicians about the trade-offs between statistical rigor and clinical interpretability in the quest for earlier and more accurate identification of individuals at risk for T2DM.
Instrument and Methods
This investigation was carried out on a subset of the Dena-PERSIAN cohort, which enrolled adults aged 35 to 70 years. Information from 3,203 individuals was used, of whom 402 (12.55%) had a confirmed diagnosis of T2DM. The dataset included parameters from demographic (e.g., age), laboratory (e.g., fasting blood sugar (FBS), lipid profile), lifestyle (e.g., driving hours, television watching), and medical history (e.g., fatty liver, kidney stones) domains.
Before analysis, the data underwent several preparation steps. Missing entries were estimated using multivariate iterative imputation [6]. Continuous parameters were rescaled to fall within a 0-1 range, and categorical parameters were converted into binary indicators. Unusual values were addressed using interquartile range checks, while skewed parameters were smoothed using a Yeo-Johnson adjustment [7].
The analysis used retrospective, anonymized data from the PERSIAN cohort (adults aged 35-70 years). This study adhered to the Declaration of Helsinki. All participants in the original cohort provided written informed consent for the future research use of their data. No direct participant contact occurred, and all records were de-identified before analysis.
Because individuals with diabetes made up only about one in eight participants, we balanced the dataset using the SMOTE [8-10]. This approach generates synthetic diabetes cases until both classes appear in roughly equal numbers, reducing the bias of the model toward the majority group.
We compared three classical filter methods: ANOVA (f-classif), which identifies continuous predictors that effectively separate diabetic and non-diabetic groups; MI, which estimates the extent to which knowledge of one parameter reduces uncertainty about diabetes status [11-13]; and Chi-square (χ²), which assesses the dependence between categorical or non-negative predictors and the outcome [14].
Each method produced a ranked list of predictors. For fairness, we retained only the top five from each list and used these in model training.
Separate logistic regression models were created for each feature set (one for ANOVA, one for MI, and one for the Chi-square test). Training utilized 80% of the data, while 20% was reserved as the test set. Models were fitted with a maximum of 1,000 iterations and a fixed random seed to ensure reproducibility. Performance was assessed on the test set using accuracy, precision, recall, and F1-score [3, 4].
All steps were coordinated in the PyCaret environment, which streamlined preprocessing, feature selection, and model training into a single reproducible pipeline. Within PyCaret, we applied the same transformations described earlier (imputation, scaling, variance reduction, and multicollinearity pruning) before model fitting. This framework ensured consistency across all three feature selection strategies.
Analyses were run in Python 3.10. The libraries included scikit-learn for modeling, imbalanced-learn for SMOTE, PyCaret for workflow automation, and Plotly for figures. The entire project was managed under version control and containerized with Docker, ensuring that the analysis can be replicated on other systems without changes.
Findings
Of 3,203 adults, 402 participants (12.55%) had T2DM, while 2,801 (87.45%) were non-diabetic. Before modeling, the dataset underwent several preparation steps. Records with more than half of their values missing were removed, features with very low variability were excluded, and the remaining gaps were filled using a most-frequent strategy. After these steps, the working dataset consisted of 3,203 samples and 80 predictors covering demographic, lifestyle, laboratory, and medical history parameters (Table 1).
Table 1. Features and specifications of the dataset
ANOVA ranked FBS at the top, followed by age and fatty liver status, with triglycerides (TG) and kidney stone history completing the five most influential features (Figure 1). The sharp drop in scores after the first three indicated that most of the predictive value lay within this compact clinical core.
Figure 1. Most important features ranked by ANOVA (f-classif).
MI also prioritized FBS and age, but it assigned weight to HDL-C and two daily driving time and television viewing lifestyle behaviors (Figure 2). These non-linear associations were plausible contributors to risk, but they did not enhance performance in a linear classifier.
Figure 2. Most important features ranked by mutual information.
Chi-square test emphasized categorical parameters, ranking fatty liver and kidney stones above age, energy drink use (BAVARAGE), and FBS (Figure 3). While clinically relevant, these features provided weaker linear separability compared to continuous laboratory measures.
Figure 3. Most important features ranked by the Chi-square test.
Because each method emphasized a slightly different mix of features, a side-by-side comparison helps identify the predictors that were stable across methods versus those that were method-specific. FBS and age were universal; fatty liver and kidney stones appeared in two methods, while TG (ANOVA), HDL-C, lifestyle factors (MI), and energy drink use (Chi-square test) were unique (Table 2).
Table 2. Shared and unique top features across the three filter methods
When logistic regression models were trained on the top five features from each method, both ANOVA and MI achieved strong and nearly identical results (Figure 4, Table 3). The ANOVA-based model produced an accuracy of 0.84 and an F1-score of 0.84, while the MI-based model also reached an accuracy of 0.84 and an F1-score of 0.84, with slightly higher precision (0.85). The Chi-square-based model performed slightly lower, with an accuracy of 0.82 and an F1-score of 0.82.
This indicates that both ANOVA and MI identified feature sets that worked well with a linear model, albeit with different emphases (ANOVA on metabolic markers and MI on lifestyle and lipid features). Chi-square test, while still reasonably strong, lagged behind slightly due to its focus on categorical indicators.
Figure 4. Test-set performance of logistic regression models trained on features selected by ANOVA, mutual information, and Chi-square test.
Table 3. Performance metrics of logistic regression models on the test set
The consolidated ranking of the top 15 features (Figure 5) confirmed the dominance of FBS, age, and fatty liver status, which consistently appeared at the top across all methods. Additional contributors included kidney stones and TG (ANOVA and Chi-square test), HDL-C (MI), and lifestyle parameters, such as driving time, television viewing, and energy drink use. The steep decline in importance beyond the first five predictors suggests that most of the discriminative capacity resides in a small clinical core, with secondary features adding marginal or context-specific value.
Figure 5. The top 15 most important features across ANOVA, mutual information, and Chi-square test.
The consensus analysis confirmed that most of the predictive strength was concentrated in a compactt triad of FBS, age, and fatty liver, with other parameters adding method-specific but modest value.
Discussion
This study compared three classical filter-based feature selection methods (ANOVA, MI, and Chi-square test) for predicting T2DM using data from the Dena Cohort. Across all methods, FBS and age consistently emerged as dominant predictors, reinforcing their central role in diabetes risk assessment [12-14]. Fatty liver was also highlighted by ANOVA and Chi-square test, aligning with prior evidence linking non-alcoholic fatty liver disease to insulin resistance and subsequent diabetes onset [15, 16].
When evaluated in logistic regression models, ANOVA and MI achieved nearly identical performance (accuracy and F1-score=0.84), while the Chi-square test lagged slightly (accuracy=0.82; F1-score=0.82). This finding suggests that both ANOVA and MI can generate clinically useful predictor subsets for linear models, though their emphases differ: ANOVA favored metabolic and biochemical parameters, whereas MI captured lipid abnormalities and lifestyle behaviors, such as driving and television viewing. These patterns echo recent large-scale evidence, including results from the UK Biobank (≈450,000 participants), where metabolic factors, such as HbA1c, BMI, waist circumference, and liver enzymes dominated prediction, but lifestyle indicators and HDL cholesterol also contributed significantly [17].
The results also align with a broader trend in diabetes prediction research. Li et al. emphasized that while logistic regression remains widely used in clinical studies, its performance is vulnerable to multicollinearity and redundant parameters, underscoring the importance of effective feature selection [18]. A recent systematic review and meta-analysis of machine learning models confirms that appropriate feature selection substantially improves both accuracy and interpretability in diabetes prediction [19]. Ensemble frameworks that combine multiple feature selection strategies with classifiers have also been shown to enhance robustness and reduce model variance, particularly in heterogeneous datasets [20].
Interpretability remains another critical theme. SHAP-based methods have gained traction as a way to bridge machine learning predictions with clinical understanding by quantifying the contribution of each feature to individual risk scores [21]. Such approaches highlight the importance of not only achieving accuracy but also ensuring transparency in decision-support systems. Likewise, hybrid deep learning approaches that integrate feature selection with advanced architectures are increasingly being tested for early diabetes detection, though their complexity raises new challenges for implementation in routine care [22].
A major strength of our work lies in the standardized preprocessing pipeline, which includes imputation, normalization, and oversampling with SMOTE. This approach reduced bias caused by class imbalance and ensured comparability across methods [9-11]. The convergence of results, particularly the consistent identification of FBS, age, and fatty liver, underscores the robustness of these predictors across different statistical approaches and reflects their established clinical importance.
Nevertheless, some limitations must be acknowledged. First, the analysis was restricted to a single cohort, which may limit generalizability. Second, we only tested one classifier, logistic regression, which may not fully leverage the non-linear features emphasized by MI. Prior studies show that these features may contribute more substantially in ensemble or tree-based models [17, 18, 20, 23]. Finally, although the preprocessing was carefully designed, some categorical variables may have lost nuance through one-hot encoding, potentially reducing their discriminative capacity.
Future work should therefore expand validation to multi-cohort datasets, test non-linear classifiers, and examine hybrid or metaheuristic pipelines that integrate filter methods with advanced optimization strategies [22, 24-26]. By combining interpretability with predictive strength, such models can support clinicians in identifying high-risk individuals earlier, ultimately guiding more effective preventive strategies and resource allocation.
We compared three classical filter-based feature selection methods for T2DM prediction using data from the Dena-PERSIAN cohort. Across all approaches, FBS, age, and fatty liver consistently emerged as the most robust predictors, while ANOVA and MI provided the strongest and most clinically meaningful feature subsets. These findings highlight the value of ANOVA and MI for building interpretable prediction models and suggest that their complementary strengths may be best leveraged in hybrid or ensemble frameworks for early diabetes risk assessment.
Conclusion
ANOVA and MI produce clinically meaningful and stable feature subsets for T2DM prediction, centered on fasting glucose, age, and fatty liver.
Acknowledgments: The authors thank the Dena-PERSIAN Cohort study team for their invaluable efforts in data collection and management. The Social Determinants of Health Research Center at Yasuj University of Medical Sciences is also acknowledged for its academic support and technical advice during the study.
Ethical Permissions: Ethical approval was granted by the Institutional Review Board of Yasuj University of Medical Sciences, Yasuj, Iran (IR.YUMS.REC.1402.152).
Conflicts of Interests: The authors declared no conflicts of interests related to this work.
Authors' Contribution: Ghaderzadeh M (First Author), Introduction Writer/Methodologist/Assistant Researcher/Discussion Writer/Statistical Analyst (40%); Salehnasab C (Second Author), Introduction Writer/Methodologist/Main Researcher/Discussion Writer/Statistical Analyst (60%)
Funding/Support: This study did not receive any external funding. All analyses and manuscript preparation were conducted with institutional support from the Yasuj University of Medical Sciences.
Keywords:
Type 2 Diabetes [MeSH], Life Style [MeSH], ANOVA [MeSH], Chi-Square Test [MeSH], Logistic Regression [MeSH]
References
1. International Diabetes Federation. IDF diabetes atlas. 11th ed. Brussels: International Diabetes Federation; 2025. [Link]
2. GBD 2021 Diabetes Collaborators. Global, regional, and national burden of diabetes from 1990 to 2021, with projections of prevalence to 2050: A systematic analysis for the Global Burden of Disease Study 2021. Lancet. 2023;402(10397):203-34. [Link] [DOI:10.1016/S0140-6736(23)01301-6]
3. Parker ED, Lin J, Mahoney T, Ume N, Yang G, Gabbay RA, et al. Economic costs of diabetes in the U.S. in 2022. Diabetes Care. 2024;47(1):26-43. [Link] [DOI:10.2337/dci23-0085]
4. Bommer C, Sagalova V, Heesemann E, Manne-Goehler J, Atun R, Bärnighausen T, et al. Global and regional economic burden of diabetes in adults: Projections from 2015 to 2030. Diabetes Care. 2018;41(5):963-70. [Link] [DOI:10.2337/dc17-1962]
5. Williams R, Karuranga S, Malanda B, Saeedi P, Basit A, Besançon S, Bommer C, Esteghamati A, Ogurtsova K, Zhang P, Colagiuri S. Global and regional estimates and projections of diabetes-related health expenditure: Results from the International Diabetes Federation Diabetes Atlas. Diabetes Res Clin Pract. 2020;162:108072. [Link] [DOI:10.1016/j.diabres.2020.108072]
6. Joshi RD, Dhakal CK. Predicting type 2 diabetes using logistic regression and SMOTE. Int J Environ Res Public Health. 2021;18(14):7346. [Link] [DOI:10.3390/ijerph18147346]
7. Van Buuren S, Groothuis-Oudshoorn K. Mice: Multivariate imputation by chained equations in R. J Stat Softw. 2011;45(3):1-67. [Link] [DOI:10.18637/jss.v045.i03]
8. Yeo IK, Johnson RA. A new family of power transformations to improve normality or symmetry. Biometrika. 2000;87(4):954-9. [Link] [DOI:10.1093/biomet/87.4.954]
9. Chawla NV, Bowyer KW, Hall LO, Kegelmeyer WP. SMOTE: Synthetic minority over-sampling technique. J Artif Intell Res. 2002;16:321-57. [Link] [DOI:10.1613/jair.953]
10. Fernández A, García S, Herrera F, Chawla NV. SMOTE for learning from imbalanced data: Progress and challenges. J Artif Intell Res. 2018;61:863-905. [Link] [DOI:10.1613/jair.1.11192]
11. Alghamdi M, Al-Mallah M, Keteyian S, Brawner C, Ehrman J, Sakr S. Predicting diabetes mellitus using SMOTE and ensemble machine learning approach: The Henry Ford Exercise Testing (FIT) project. PLoS One. 2017;12(7):e0179805. [Link] [DOI:10.1371/journal.pone.0179805]
12. Pudjihartono N, Fadason T, Kempa-Liehr AW, O'Sullivan JM. A review of feature selection methods for machine learning-based disease risk prediction. Front Bioinform. 2022;2:927312. [Link] [DOI:10.3389/fbinf.2022.927312]
13. Vergara JR, Estévez PA. A review of feature selection methods based on mutual information. Neural Comput Appl. 2014;24:175-86. [Link] [DOI:10.1007/s00521-013-1368-0]
14. Verleysen M, Rossi F, Francois D. Advances in feature selection with mutual information. Similarity Based Clust. 2009;50(3):670-84. [Link] [DOI:10.1007/978-3-642-01805-3_4]
15. Yki-Järvinen H. Non-alcoholic fatty liver disease as a cause and a consequence of metabolic syndrome. Lancet Diabetes Endocrinol. 2014;2(11):901-10. [Link] [DOI:10.1016/S2213-8587(14)70032-4]
16. Byrne CD, Targher G. NAFLD: A multisystem disease. J Hepatol. 2015;62(1 Suppl):S47-64. [Link] [DOI:10.1016/j.jhep.2014.12.012]
17. Lugner M, Rawshani A, Helleryd E, Eliasson B. Identifying top ten predictors of type 2 diabetes through machine learning analysis of UK Biobank data. Sci Rep. 2024;14(1):2102. [Link] [DOI:10.1038/s41598-024-52023-5]
18. Li X, Ding F, Zhang L, Zhao S, Hu Z, Ma Z, et al. Interpretable machine learning method to predict the risk of pre-diabetes using a national-wide cross-sectional data: Evidence from CHNSt. BMC Public Health. 2025;25:1145. [Link] [DOI:10.1186/s12889-025-22419-7]
19. Liu Q, Gong C, Geng Y, You J. Elevated alanine transaminase is nonlinearly associated with in-hospital death in ICU-admitted diabetic ketoacidosis patients. Diabetes Res Clin Pract. 2023;197:110555. [Link] [DOI:10.1016/j.diabres.2023.110555]
20. Upadhyay S, Gupta YK. Development of Web-based Novel Machine Learning Model Using Boosting Techniques for Early Prediction of Diabetes in Indian Adults. In2023 12th International Conference on System Modeling & Advancement in Research Trends (SMART). 2023 Dec 22. 592-602. IEEE. [Link] [DOI:10.1109/SMART59791.2023.10428549]
21. Patil R, Patil A, Janrao S, Bankar S, Shah K. A Framework for Prediction of Type II Diabetes through Ensemble Stacking Model. J Electron Electromed Engn Med Inform. 2024 Sep 16;6(4):459-66.. [Link] [DOI:10.35882/jeeemi.v6i4.497]
22. Nadesh RK, Arivuselvan K. Type 2: diabetes mellitus prediction using deep neural networks classifier. Int J Cogn Comput Eng. 2020;1:55-61.. [Link] [DOI:10.1016/j.ijcce.2020.10.002]
23. Healy GN, Matthews CE, Dunstan DW, Winkler EA, Owen N. Sedentary time and cardio-metabolic biomarkers in US adults: NHANES 2003-06. Eur Heart J. 2011;32(5):590-7. [Link] [DOI:10.1093/eurheartj/ehq451]
24. Katzmarzyk PT, Church TS, Craig CL, Bouchard C. Sitting time and mortality from all causes, cardiovascular disease, and cancer. Med Sci Sports Exerc. 2009;41(5):998-1005. [Link] [DOI:10.1249/MSS.0b013e3181930355]
25. Mohtasham F, Pourhoseingholi MA, Hashemi Nazari SS, Kavousi K, Zali MR. Comparative analysis of feature selection techniques for COVID-19 dataset. Sci Rep. 2024;14:18627. [Link] [DOI:10.1038/s41598-024-69209-6]
26. Upadhyay S, Gupta YK. Enhancing Early Diagnosis of Type II Diabetes through Feature Selection and Hybrid Metaheuristic Optimization Techniques. Open Bioinform J. 2025;18(1). [Link] [DOI:10.2174/0118750362382139250502100340]